Fluorescence spectroscopy is a powerful tool for identifying the presence of both organic and inorganic molecules in complex systems.
This can be accomplished by either utilizing the inherent fluorescence properties of the molecule – a process also referred to as ‘autofluorescence’ – or by introducing a molecular tag into the system which has a known fluorescence spectrum and an affinity for the molecule of interest. These fluorescent tags, also known as ‘fluorophores’, can be engineered with specific absorption and emission bands enabling the use of multiplexing to detect a wide variety of species in a single analyte.
This technique is widely utilized in many biological and biomedical applications including DNA sequencing, and when used in tandem with confocal microscopy, provides multispectral images of cells and other small objects. Another typical application of fluorescence spectroscopy comes from the field of anti-counterfeiting, where fluorescent tags are added to the ink of currency. When illuminated by the proper excitation wavelength, these tags emit a unique fluorescence spectrum known only to the manufacturer.
Theory of Fluorescence Spectroscopy
To fully understand just how powerful fluorescence spectroscopy is, it is useful to briefly explore the fundamental physics involved. Before the fluorescence process can occur, a molecule must first absorb a photon with enough energy to excite the system from the ground state (So) to the next electronic energy level (S1). Once the molecule is in the excited state, it releases this excess energy as quickly as possible to relax back down to the more stable ground state. This excess energy must be converted into a combination of phonons and photons called non-radiative or radiative decay. As shown in Figure 1, in the case of fluorescence emission, the molecule will first drop to a lower vibrational state non-radiatively in the S1 band before radiatively decaying to the S0 band. This process results in the emitted photon having less energy than the absorbed photon, therefore ‘shifting’ to a longer wavelength compared to the absorbed photon, this shift in wavelength is referred to as a ‘Stokes shift’ and is demonstrated in the Jablonski diagram of electronic states.

The intraband vibrational mode structure and the energy differential between S0 and S1 are highly dependent on the molecular bond structure, particularly the presence of double and triple bonds which exploit loosely bound p-electrons. As a result, complex organic and biological molecules tend to exhibit high autofluorescence. This response is why the life sciences were among the earliest adaptors of fluorescence spectroscopy and allows for the design of large organic molecules known as fluorophores with specific absorption and emission properties tailored for specific applications. Furthermore, these fluorophores can be designed to bond with specific molecules of interest, creating chemically sensitive fluorescence tags such as those mentioned previously for DNA sequencing. In recent years, quantum dots have also become popular in fluoresce applications. In this case, the emission spectra are not related as much to the molecular structure of the material but instead are dependent on the size of the quantum dot itself. As the cost and complexity of nanofabrication technology have come down over the past decade, quantum dots are increasingly used for a wide range of fluorescence applications including anti-counterfeiting.
Typical Measurement Configurations
Because fluorescence spectroscopy can be used in such a wide variety of applications, the instrumentational configurations also vary widely depending on the application. For this reason, most researchers prefer to use configurable components which can be easily swapped in and out depending on the needs of the specific application. Avantes has worked closely with many researchers and process engineers to facilitate fluorescence measurements in the laboratory, clinical, and industrial environments using our fibre-coupled miniature spectrometers, light sources, and accessories. Over this period, we have developed a full suite of fluorescence spectroscopy configurations, which researchers have been able to use in both laboratory and translational research. Many of these configurations have also served as the basis for a wide range of commercial products which utilize Avantes’ OEM spectrometers as their measurement tool.
Due to the relatively low-energy levels associated with fluorescence spectroscopy compared to other methods such as UV/Vis spectroscopy, it is generally preferable to select a high-sensitivity spectrometer such as the AvaSpec-HERO or the AvaSpec-HS2048XL-EVO. Higher-sensitivity spectrometers such as these are particularly useful in more demanding applications such as the measurement of autofluorescence in tissues or the detection of low-concentration fluorophores in a sample matrix. Fortunately, though, when compared to other low-light spectroscopy applications, such as Raman spectroscopy and diffuse reflection spectroscopy, fluorescence has the advantage of relatively broad emission bands allowing for spectroscopists working with stronger fluorescing samples to alternatively consider a less sensitive spectrometer such as the AvaSpec-ULS2048CL-EVO or the AvaSpec-Mini2048CL with a wide entrance slit to accept more light into the spectrometer. Nearly all Avantes spectrometers come with the option of replaceable entrance slits, which allow the user to experimentally determine the optimal entrance slit width for each specific fluorescence application, further enhancing the flexibility afforded by fibre- coupled miniature spectrometers.
Cuvette-Based Measurements
The simplest of all fluorescence spectroscopy set-ups utilizes a fibre-coupled cuvette holder with orthogonal connection ports to collect spectra from a sample in solution in a standard 10ml cuvette. This approach is possible because most small molecule solvents, such as water, alcohol, and cyclohexane, have virtually no autofluorescence signal, allowing for the sample and fluorophore to be dissolved in a solution for easy handling.
While similar to typical UV/Vis measurements, in a fluorescence measurement configuration, the excitation port, and the collection port must be orthogonal (at 90-degree angles) to each other, as shown in Figure 2 below, to prevent transmitted light from the excitation source from overpowering the fluorescence single. When utilizing this fluorescence measurement configuration, the port in line with the excitation source might be left open to prevent the transmitted light from reflecting around inside of the cuvette holder. It may also be capped with a mirror to create a double pass cell, or connected to a second spectrometer in order to simultaneously measure the UV/Vis absorption spectrum. The dual UV/Vis and fluorescence capability of this simple component set-up is particularly useful for performing quality control during the manufacturing of fluorescent dyes and quantum dots as it allows for the simultaneous determination of the excitation and emission properties of the molecule.

Additionally, a thermoelectrically controlled cuvette holder like the CUV-UV/VIS-TC (displayed in Figure 2) allows the operator to precisely control the temperature of the sample between -30°C and +105°C with an accuracy of 0.05°C. This type of cuvette holder not only provides the ability to stabilize the temperature of the sample during the measurement but also allows for the sample temperature to be varied in real time, allowing for the quantification of temperature effects on the emission spectra.
Probe-Based Measurements
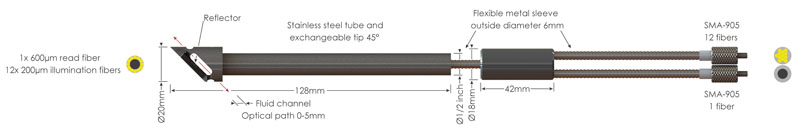
While cuvettes work well for many applications, it is not always desirable to remove a sample for testing purposes. When testing liquid or powder samples, one alternative is to utilize a fibre-optic fluorescence probe like the one shown in Figure 3. These probes use a bifurcated design allowing the excitation source to be coupled to one leg and the spectrometer to the other leg. While these probes can utilize many different internal fibre configurations, for example, twelve 200-micron core fibres surrounding one 600-micron core fibre as shown in Figure 3, they all have one thing in common: the excitation and collection paths at the sample are both colinear. This geometry dramatically simplifies the probe design allowing for a compact form factor, but it does result in increased excitation signal collection compared to the orthogonal approach utilized by a cuvette holder.
To mitigate the collection issues associated with this fluorescence system configuration, it becomes necessary to add additional filtration steps along the collection path. Avantes offers both inline and direct attached filter holders which allow the user to filter the signal on both the excitation and collection paths. Typically, placing a bandpass filter in the excitation line, and only allowing light in the excitation band into the probe will accomplish this. Since there is no such thing as a perfect filter, however, it is often necessary to add a long pass filter on the collection path to further reduce the excess light from the excitation source. Figure 4 shows an example set-up where the FH-DA direct attach filter holder is attached to the excitation light source, and an FH-INL inline filter holder is inserted between the collection leg of the bifurcated fibre and a patch cord connected to the spectrometer.

In addition to standard immersion measurements, fluorescence probes are also ideal for in situ testing in a wide variety of fields ranging from biomedical diagnostics to archaeological research. For each of these applications, the probe fibre configuration may be slightly different from the example shown in Figure 2, but the overall principle remains the same. One unique application of fluorescence probes are in dental curing, where the ultraviolet light source can serve both as the catalyst for curing and as the excitation source for the fluorescence measurement itself.
Another interesting utilization of these probes is in art authentication, where the fluorescence spectra can provide insight into pigments used in the production of a painting, allowing investigators to determine if the paint used matches the period when that work of art was allegedly produced. However, overexposure to ultraviolet light can also damage the pigments themselves, so ensuring the integrity of the work requires additional care.
Fluorescence Microscopy
Fluorescence microscopy dates to the early 20th-century, coinciding with the invention of the ultraviolet microscope in 1911. Early researchers in the field quickly realized that ultraviolet excitation – which was originally chosen in an attempt to increase spatial resolution of the images – was inducing autofluorescence in their samples, and by 1914 they had demonstrated that fluorophores could be created to bind to living cells which allowed molecular information to be ascertained on the microscopic level for the first time.
Since then, fluorescence microscopy has become one of the most widely utilized techniques in biological sciences, providing high-resolution hyperspectral imaging of living cells and other biological samples. While in most cases, the excitation source is a single mode laser to allow for diffraction limited imaging, the spectrometer requirements are otherwise virtually the same as the other configuration discussed earlier. Avantes offers three standard microscope adaptors which allow the user to easily connect a miniature spectrometer to any standard microscope port via a fibre-optic patch cord.
Final Thoughts
Avantes offers a wide range of spectrometers and accessories that are ideal for both laboratory and OEM fluorescence spectroscopy applications including the AvaSpec-HS2048XL-EVO, AvaSpec-HSC1024X58-TEC (AvaSpec-Hero), and AvaSpec-ULS2048XL-EVO. Each of these spectrometers is available as either a standalone unit, OEM module, or can be integrated into a multichannel rack mount system that combines excitation source and spectrometer(s) in a single housing, making them ideal for custom-designed laboratory or inline systems. The AvaSpec instrument line communicates via USB3.0, Ethernet, RS-232 and allows active digital & analogue input/output capabilities providing a multitude of interface options with other devices. Additionally, the Avantes AvaSpec DLL software development application, with sample programs in Labview, MatLab, Delphi, Visual Basic, C#, C++, and many other programming environments, enables users to develop their own code for fluorescence applications.
For more information about the full range of spectrometer options available from Avantes for fluorescence spectroscopy, contact us at info@avantes.com to discuss your spectroscopy application with a knowledgeable applications specialist today.