Optical spectroscopy is a technique that is used to measure light intensity in the ultraviolet (UV), visible (VIS), near-infrared (NIR), and infrared (IR) range of the electromagnetic spectrum. Spectroscopic measurements are used in many different applications, such as color measurement, concentration determination of chemical components, or electromagnetic radiation analysis.
Table of contents
- How does a spectrometer work?
- Optical bench design?
- How to configure a spectrometer for your application
- Grating the spectrometer and how to choose the right grating
- How to select the optimum resolution
- Detector arrays
- Sensitivity
- Stray light and second order effects
- Thermal stability
- Spectrometer platforms
- Sensline
- NIRLine
How Does a Spectrometer Work?
A spectroscopic instrument, or spectrometer, generally consists of entrance slit, collimator, a dispersive element such as a grating or prism, focusing optics, and a detector. In a monochromator system, there is normally also an exit slit, and only a narrow portion of the spectrum is projected on a one-element detector. In monochromators, the entrance and exit slits are in a fixed position and can be changed in width. Rotating the grating scans the spectrum.
The development of microelectronics during the 1990s in the field of multi-element optical detectors, such as charged-coupled device (CCD) arrays and complementary metal-oxide-semiconductor (CMOS) arrays, enabled the production of low-cost scanners, CCD cameras, etc. These same CCD and CMOS detectors are now used in the Avantes AvaSpec line of spectrometers, enabling fast scanning of the spectrum, without the need for a moving grating.
Thanks to the need for fiber-optics in communication technology, low-absorption silica fibers have been developed. Similar fibers can be used as measurement fibers to transport light from the sample to the optical bench of the spectrometer. The easy coupling of fibers allows a modular build-up of a system that consists of a light source, sampling accessories, and a fiber-optic spectrometer. Furthermore, fiber optics enable the introduction of sampling into harsh and difficult-to-access environments.
The low-cost, modularity, flexibility and speed of measurement made possible by fiber-optic spectrometers have resulted in wide adoption of this technology in a variety of industries.
Optical Bench Design
The heart of most AvaSpec fiber-optic spectrometers is an optical bench with 37.5, 45, 50, or 75mm focal length, developed in a symmetrical Czerny-Turner design. Light enters the optical bench through a standard SMA-905 connector and is collimated by a spherical mirror. A plain grating diffracts the collimated light after which a second spherical mirror focuses the resulting diffracted light. An image of the spectrum is projected onto a 1-dimensional linear detector array.
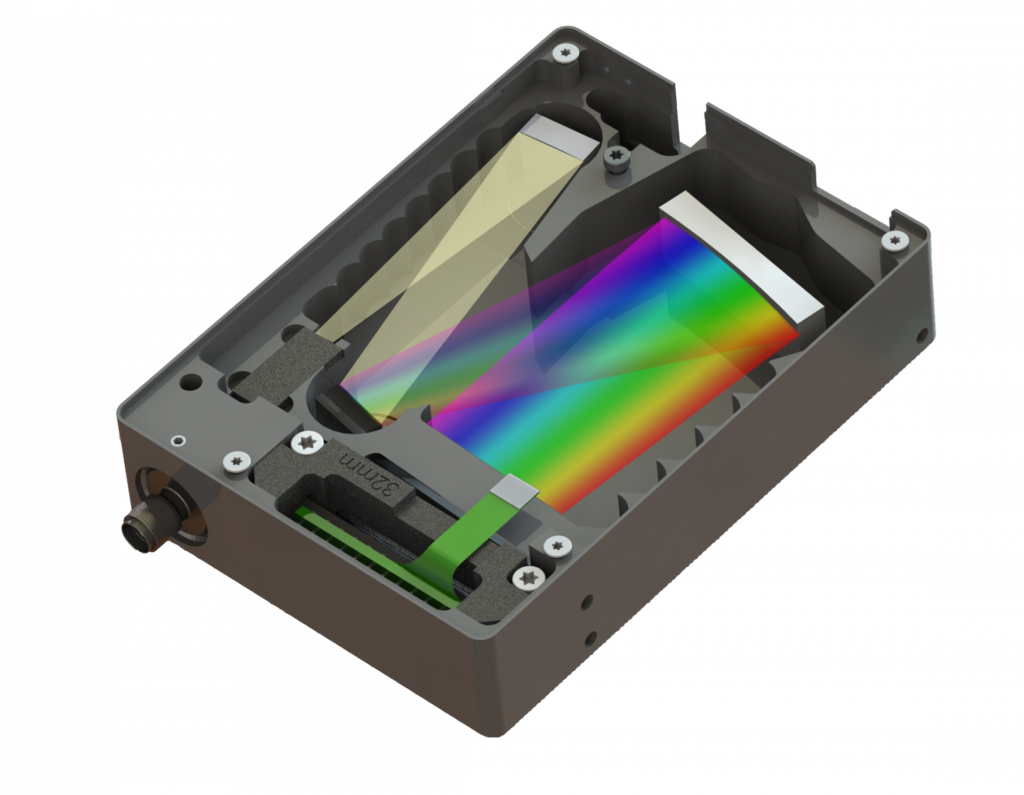
Avantes’ high-sensitivity spectrometers have a revolutionary optical bench design with multiple toroid mirrors which ensure that the full numerical aperture of the fiber entrance will be projected on the back-thinned CCD array.
All of our optical benches have a number of components installed inside, allowing a wide variety of different configurations, depending on the intended application. The choice of these components, such as the diffraction grating, entrance slit, order-sorting filter, and detector coating has a strong influence on system specifications such as sensitivity, resolution, bandwidth, and stray light.
Why choose Avantes for your application?
- Market leader in developing high-end fibre-optic spectroscopy systems
- Nearly 30 years of experience and extensive industry and application knowledge
- The best engineers who perform feasibility studies to find the right solution for your application
- A support team that never sleeps and provides second-to-none customer service
How to Configure a Spectrometer For Your Application
The modular AvaSpec line of instruments provides you with a number of configuration options to optimize the optical and spectroscopic performance of your instrument for your application.
Wavelength Range
When determining the optimum configuration of a spectrometer system, the wavelength range is a key parameter that defines the appropriate grating choice. If you are looking for a wide (broadband) wavelength range, we recommend using a 300 lines/mm grating, known as an A-type grating in the Avantes product line. For a smaller range (approximately 500 nm) but higher resolution, you might consider 600 lines/mm, or B-type grating.
Higher lines/mm gratings (1200 – C-type, 1800 – D-type, 2400 – E-type, 3600 – F-type) provide higher resolution for applications that require this. Broadband gratings provide the greatest flexibility but may not provide the best performance for a specific application. Contact an Avantes sales engineer for a recommended grating configuration.
Detector Choice
The choice of your wavelength range along with the demands of your measurement speed and accuracy often suggests the appropriate detector for your application. Avantes offers a variety of different detector types, each with different sensitivity curves.
The AvaSpec instrument line is divided into multiple groups, based on general requirements:
- The AvaSpec StarLine is comprised of general purpose UV/VIS instruments with low-cost CCD or CMOS detectors.
- The AvaSpec SensLine is comprised of higher-performance back-thinned CCDs and thermo-electrically cooled CCD UV/VIS instruments. These instruments are particularly better in the UV and NIR range, compared to standard CCD and CMOS detectors.
- The AvaSpec NIRLine is comprised of instruments with InGaAs arrays for longer wavelength measurements, ranging from 900-2500 nm, suitable for various applications.
- For applications where the size of the instrument is a critical factor, Avantes offers the CompactLine with spectrometers that have a small form factor.
The modularity and inter-compatibility of the AvaSpec line also make it possible to combine two or more detectors in a single instrument enclosure to provide optimum performance over a broad wavelength range. For example, an AvaSpec StarLine (UV/VIS) spectrometer can be combined with a NIRLine spectrometer to enable measurements from 200-2500 nm in a single instrument.
For high-speed applications, the 2048 pixel CMOS detectors in the AvaSpec-ULS2048CL-EVO from the StarLine are normally the best options. For low-light-level applications such as fluorescence and Raman, the SensLine instruments may be the most appropriate.
Optical Resolution & Slit Size
If a high optical resolution is required, you may want to consider a grating with higher lines/mm (1200 – C-type, 1800 – D-type, 2400 – E-type, 3600 – F-type), thus limiting the range of the instrument to a more narrow range. Additionally, it is advisable to consider a detector with 2048 or 4096 pixels and a small slit (10 or 25 µm). For the best resolution with all other less important criteria, the AvaSpec-ULS4096CL with a 10-micron slit is optimumly suited.
Slit size is a key factor in determining both resolution and throughput into the optical bench. It is important to balance the need for resolution with the need for sensitivity and throughput in the optical bench. If the resolution is optimized without considering the need for throughput, you may not have enough light to provide a stable measurement. As previously mentioned, for optimum resolution our smallest slit (10 microns) is recommended. If your application does not require the highest possible resolution and is not one that has an excess of light (laser measurement for example), we recommend that you consider as large a slit as possible to maximize throughput into the optical bench.
The AvaSpec-RS with a replaceable slit makes your spectrometer a versatile instrument for both high-resolution and high-sensitivity measurements.
Sensitivity
When considering sensitivity, it is very important to distinguish between photometric sensitivity (how much light is needed for a detectable signal) and chemometric sensitivity (what absorbance difference level can still be detected).
Photometric Sensitivity
For the best photometric sensitivity, a combination of a high-throughput optical bench and a high quantum efficiency (QE) detector is recommended. The instruments in the AvaSpec SensLine are specifically optimized for photometric sensitivity.
Fluorescence applications, for example, require high photometric sensitivity. Avantes AvaSpec-HS2048XL-EVO is the highest performing instrument we offer for this application.
For Raman applications where the combination of resolution and sensitivity is required, we commonly recommend our AvaSpec-HERO with thermoelectrical cooling.
To further enhance photometric sensitivity, we recommend using a detector collection lens (DCL-UV/VIS or DCL-UV/VIS-200), which is a cylindrical lens that focuses light from larger core fiber optics and bundles down onto the smaller detector pixels.
For additional photometric sensitivity, a larger slit or no slit and a 300 line/mm A-type grating to minimize light dispersion is available. Some more demanding applications also require thermoelectric cooling of the CCD detector (see AvaSpec-HERO) to minimize noise and increase dynamic range at long integration times (up to 60 seconds).
Chemometric Sensitivity
To detect drastically different absorbance values, close to each other with maximum sensitivity, you need a high signal-to-noise (S/N) performance. The detectors with the best S/N performance are again in the AvaSpec SensLine series spectrometers with the AvaSpec-HERO at the top of the line. The S/N performance can also be enhanced by averaging multiple spectra. The square root of the number of averages translates to the improvement in signal to noise.
Integrate Timing and Speed
The data capture process is inherently faster with linear detector arrays and no moving parts as compared to a monochromator design. However, there are optimum detectors for each application. For high-speed applications such as measurements involving pulsed lasers and light sources, we recommend the AvaSpec-ULS2048CL-EVO spectrometers.
These instruments support high-speed data acquisition, with the capability of starting an acquisition within 1.3 microseconds of receiving an external trigger. Since data transfer time is critical for these applications, Avantes’ unique Store-to-RAM mode enables on-board storage of up to 5000 spectra to the instrument RAM buffer.
The above parameters are the most important in choosing the right spectrometer configuration. Please contact our application engineers to optimize and fine-tune the system to your needs. The table below provides a quick reference guide for spectrometer selection for many common applications. The system recommendations in this table are for simple configurations of mostly single-channel spectrometers.

Grating the Spectrometer: how to Choose the Right Grating
A diffraction grating is an optical element that separates incident polychromatic radiation into its constituent wavelengths. A grating consists of series of equally spaced parallel grooves formed in a reflective coating deposited on a suitable substrate.

The way in which the grooves are formed separates gratings into two types: holographic and ruled. The ruled gratings are physically formed onto a reflective surface with a diamond on a ruling machine. Gratings produced from laser-constructed interference patterns and a photolithographic process are known as holographic gratings.
Avantes AvaSpec spectrometers come with a permanently installed grating that must be specified by the user. Additionally, the user needs to indicate what wavelength range needs to reach the detector. Sometimes, the specified usable range of a grating is larger than the range that can be projected on the detector. In order to cover a broader range, a dual or multi-channel spectrometer may be selected. In this configuration, each channel may have different gratings covering a segment of the range of interest. In addition to a broader range, a dual or multi-channel spectrometer also affords higher resolution for each channel.
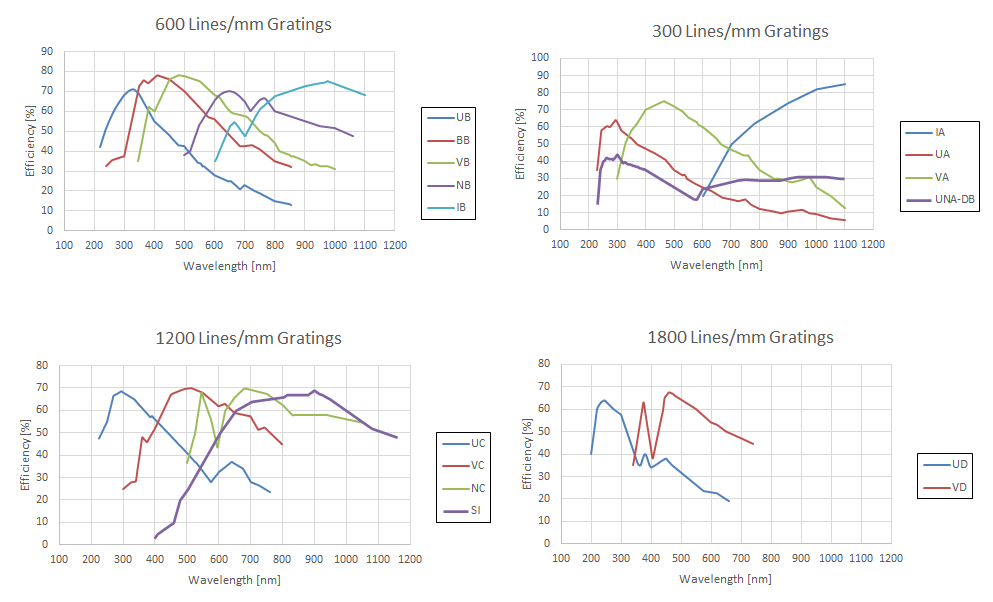
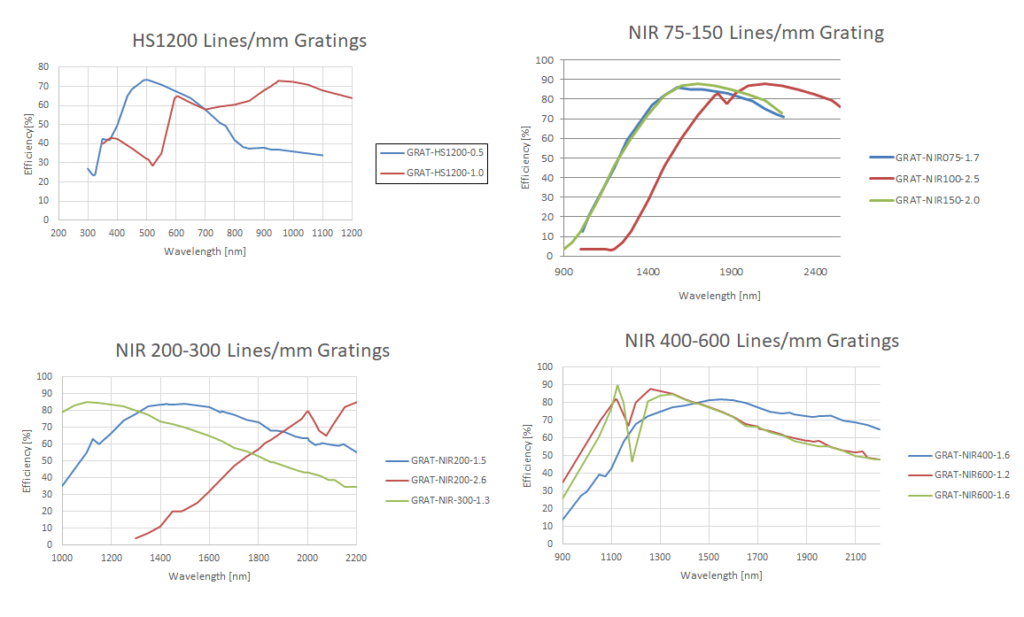
A grating selection table for each spectrometer type is shown in the Spectrometer Platform section. Table 2 illustrates how to read the grating selection table. The spectral range to select in Table 2 depends on the starting wavelength of the grating and the number of lines/mm; the higher the wavelength, the bigger the dispersion and the smaller the range to select.
Below that, each grating’s efficiency curve is shown. When looking at the grating efficiency curves, please realize that the total system efficiency will be a combination of fiber transmission, grating and mirror efficiency, detector quantum efficiency and coating sensitivities. Our dual-blazed grating is a 300 lines/mm broadband grating (covering 200-1100 nm) that has optimized efficiency in both UV and NIR.


How to Select the Optimum Optical Resolution
Optical resolution is defined as the minimum difference in wavelength that can be separated by the spectrometer. For the separation of two spectral lines, it is necessary to image them at least two array pixels apart.
Because the grating determines how far different wavelengths are separated (dispersed) at the detector array, it is an important variable for the optical resolution. The other important parameter is the width of the light beam entering the spectrometer. This is basically the installed fixed entrance slit in the spectrometer, or the fiber core when no slit is installed.
For AvaSpec spectrometers, the available slit widths are 10, 25, 50, 100, 200 µm wide x 1000 µm high and 500 µm wide x 2000 µm high. The slit image on the detector array for a given wavelength will cover a number of pixels. For two spectral lines to be separated, it is necessary that they be dispersed over at least this image size plus one pixel. When large core fibers are used, the resolution can be improved by a slit of smaller size than the fiber core. This effectively reduces the width of the light beam entering the spectrometer optical bench.
The influence of the chosen grating and the effective width of the light beam (fiber core or entrance slit) are shown in the tables provided for each AvaSpec spectrometer instrument.
In the table below, the typical resolution for the AvaSpec-ULS2048CL-EVO can be found. Please note that for the higher lines/mm gratings the pixel dispersion varies along the wavelength range and gets better towards the longer wavelengths.
The resolution in this table is defined as FWHM (Full Width at Half Maximum), which is defined as the width of the peak at 50% of the maximum intensity in nm.
Graphs with information about the pixel dispersion can be found in the Gratings section as well, so you can determine the optimum grating and resolution for your specific application.
For larger pixel-height detectors (2048XL, 4096CL) in combination with thick fibers (>200 µm) and a larger grating angle, the actual FWHM value can be 10-20% higher than the value in the table. Small core diameter fibers are recommended for the highest resolution.
All data in the resolution tables are based on averages of actual measured data (with 200 µm fibers) from our quality control system during the production process. A typical standard deviation of 10-25% (depending on the slit diameter and the grating) should be taken into account. For 10 µm slits, the typical standard deviation is somewhat higher, which is inherent to the laws of physics. The peak may fall exactly within one pixel, but may cover two pixels, causing lower measured resolution.
The replaceable slit feature is available on all ULS and NIR spectrometers. The spectrometers come with one installed slit and a slit kit that includes all four slit sizes, so you can opt for higher resolution (25 µm slit), higher throughput (200 µm slit) or somewhere in between (50 or 100 µm slits).

Detector Arrays
The AvaSpec line of spectrometers can be equipped with several types of detector arrays. Presently, we offer silicon-based CCDs, back-thinned CCDs, and CMOS arrays for the 200-1100 nm range. A complete overview of each is given in the following section: ‘Sensitivity’.
For the NIR range (1000-2500 nm), InGaAs arrays are implemented.
All detectors are tested in incoming goods inspection before they are used in our instruments. Avantes offers full traceability on the following detector specifications:
• Dark noise
• Signal to noise
• Photo response non-uniformity
• Hot pixels
StarLine and CompactLine CMOS detectors (AvaSpec-ULS2048CL/4096CL)
Both CCD (charge-coupled device) and CMOS (complementary metal-oxide semiconductor) detectors start at the same point: they convert light into electrons, just with different technologies. In the last years, CMOS sensors have improved to a point where they reach near parity with CCD devices.
Looking to the future, the CMOS detectors seem to take over the standard CCD technology in general-purpose spectrometers. In general, the CMOS detectors have a good UV response (without the need of using UV-enhancement coatings) and a higher response in the NIR range.
The overall sensitivity tends to be somewhat lower than with CCD technology, though.

SensLine Back-thinned CCD Detectors (AvaSpec-HS2048XL/2048×64/1024×58)
For applications requiring high quantum efficiency in the UV (200-350 nm) and NIR (900-1160 nm) ranges, combined with good S/N and a wide dynamic range, back-thinned CCD detectors are the right choice. Both uncooled and cooled back-thinned CCD detectors are offered, the uncooled back-thinned CCD detector has 2048 pixels with a pixel pitch of 14 µm and a height of 500 µm, to have more sensitivity and better S/N performance.
For even better sensitivity and S/N, the cooled back-thinned CCD detector is the best choice, it has 1024 pixels, each of them with 58 or 122 vertically binned pixels, giving an effective detector height of 1.4mm or nearly 3.0mm
- An advantage of the back-thinned CCD detector is the good UV and NIR sensitivity, combined with good S/N ratio and dynamic range.
- A disadvantage is the relatively higher cost.

InGaAs Linear Image Sensors (AvaSpec NIRLine)
The InGaAs linear image sensors deliver high sensitivity in the NIR wavelength range. The detector consists of a charge-amplifier array with CMOS transistors, a shift register, and a timing generator. For InGaAs detectors, the dynamic range is limited by the dark noise. No cooling is required for ranges up to 1.75 µm and these detectors are available in both 256 and 512 pixels. Detectors for the extended range (2.0-2.5 µm) all have 2-stage thermoelectric cooling (TEC) to reduce dark noise and are available in 256 and 512-pixel versions.
Seven detector versions are available:
- 256/512 pixel non-cooled InGaAs detector for the 900-1750 nm range
- 256/512 pixel cooled InGaAs detector for the 900-1750 nm range
- 256/512 pixel 2-stage cooled Extended InGaAs detector for the 1000-2200 nm range

Sensitivity
The sensitivity of a detector pixel at a certain wavelength is defined as the detector electrical output per unit of radiation energy (photons) incident to that pixel. With a given A/D converter, this can be expressed as the number of counts per mJ of incident radiation.
The relation between light energy entering the optical bench and the amount hitting a single detector pixel depends on the optical bench configuration. The efficiency curve of the grating used, the size of the input fiber or slit, the mirror performance and the use of a detector collection lens (DCL) are the main parameters.
With a given setup, it is possible to perform measurements over about six to seven decades of irradiance levels. Some standard detector specifications can be found in the detector specifications table.
Optionally, a cylindrical DCL (detector collection lens) can be mounted directly on the detector array. The quartz lens (DCL-UV/VIS for AvaSpec-ULS2048) will increase the system sensitivity by a factor of 3 to 5, depending on the fiber diameter used. The DCL-UV/VIS-200 can be used for our spectrometers with larger pixel heights to provide a better vertical distribution of light focusing on the detector and is primarily suitable for fiber diameters larger than 200 µm and round- to-linear assemblies.
Our SensLine series has the most sensitive detectors out of all of our instrument lines, as it includes back-thinned and thermoelectrically cooled (TEC) detectors.
The tables below show the UV/VIS detectors including their specifications. Additional information on how those specifications are determined is listed in the following paragraphs.
Pixel Well Depth (Electrons)
This value is specified by the detector supplier and defines how many electrons can fit in a pixel well before it is saturated. This value determines the best reachable signal-to-noise (S/N) ratio (=√(pixel well depth)).
Sensitivity in Photons/Count @ 600 nm
This is the number of photons of 600 nm that are needed to generate one count of signal on a 16-bit AD converter. The lower this number, the better the sensitivity of the detector. The calculation of the number of photons/count is (pixel well depth in electrons)/16-bit AD/quantum efficiency @ 600 nm.
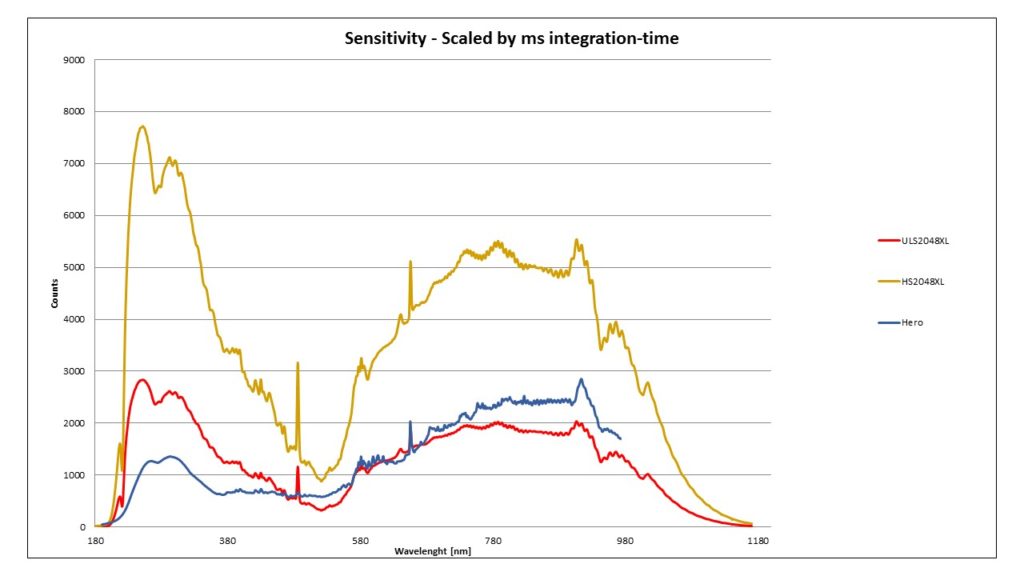
Sensitivity in Counts/µW per ms Integration Time
Sensitivity here is for the detector types currently used in the UV/VIS AvaSpec spectrometers as output in counts per ms integration time for a 16-bit AD converter. To compare the different detector arrays, we have them all built up with an optical bench with a UA 300 lines/mm grating covering 200-1100 nm, a DCL if applicable, and a 50 µm slit.
The measurement setup for 350-1100 nm has a 600 µm fiber connected to an AvaSpere-50-LS-HAL, equivalent to an optical power of 1.14 µW. For the UV/VIS measurement at 220-1100 nm, we connected the 600 µm fiber to an AvaLight-DHS through a CC-VIS/NIR diffuser, equivalent to 2.7 µW power.
Peak Wavelength and QE @ Peak
The peak wavelength is provided by the detector supplier as well as the quantum efficiency (QE), defined as the number of electrons generated by one photon.
Signal to Noise (S/N)
Signal/Noise is measured for every detector at Avantes’ Quality Control Inspection and defined as the illuminated Signal/Noise in Root Mean Square for the maximum signal. The RMS is calculated over 100 scans.
Dark Noise
Dark noise is measured for every detector at Avantes’ quality control inspection and defined as the non-illuminated noise in RMS (root mean square) for the shortest integration time. The RMS is calculated over 100 scans.
Dynamic range
The dynamic range is defined as the (maximum signal level-baseline dark level)/dark noise RMS.
Photo Response Non-Uniformity (PRNU)
Photo Response Non-Uniformity (PRNU) is defined as the maximum difference between the output of pixels when uniformly illuminated, divided by the average signal of those pixels.
PRNU is measured for every detector at Avantes’ quality control inspection.
Frequency
The frequency is the clock frequency at which the data pixels are clocked out through the AD-converter.


NIR Sensitivity
For NIR detectors, two different modes are available: high-sensitivity (HS) and low-noise (LN). The default setting is the HS mode, which provides a better signal at a shorter integration time. The other mode of operation, the LN mode, provides a better S/N (signal-to-noise) performance.
Sensitivity, S/N, dark noise and dynamic range are given as HS and LN values.

Stray Light and Second-Order Effects
Stray light
Stray light is radiation of undesired wavelengths that activates a signal at a detector element. Sources of stray light might include:
- Ambient light
- Scattered light from imperfect optical components or reflections of non-optical components
- Order overlap
Avantes’ symmetrical Czerny-Turner optical bench designs favor stray light rejection as opposed to crossed designs. Additionally, Avantes AvaSpec-ULS (ultra-low stray light) spectrometers have a number of internal measures to reduce stray light from zero-order and backscattering.
When working at the detection limit of the spectrometer system, the stray-light level from the optical bench, grating, and focusing mirrors will determine the ultimate limit of detection. Most gratings used are holographic gratings, known for their low level of stray light. Stray-light measurements are conducted using a halogen light source and long-pass or band-pass filters. Typical stray-light performance for the AvaSpec-ULS and a B-type grating is <0.04% at 250-500 nm.
Second-order effects
Second-order effects, which can play an important role for gratings with low groove frequency and therefore a wide wavelength range, are usually caused by the second-order diffracted beam of the grating. The effects of these higher orders can often be ignored, but sometimes need to be addressed using filtering. The strategy is to limit the light to the region of the spectra, where order overlap is not possible.
Second-order effects can be filtered out, using a permanently installed long-pass optical filter in the SMA entrance connector or an order-sorting coating on a window in front of the detector. The order-sorting coatings on the window typically have one long-pass filter (600 nm) or 2 long-pass filters (350 nm and 600 nm), depending on the type and range of the selected grating.

In the table below, a wide range of optical filters for installation in the optical bench can be found. The filter types that are 3mm thick give much better second-order reduction than the 1mm filters. The use of the following long-pass filters is recommended: OSF-475-3 for grating NB and NC, OSF-515-3/550-3 for grating NB and OSF-600-3 for grating IB. For back-thinned detectors, such as the 2048XL and 1024×58, we recommend an OSF-305 Filter, when the starting wavelength is 300 nm and higher.
In addition to the order-sorting coatings, we apply partial DUV coatings on the Sony 2048 detectors to avoid second-order effects from UV response and to enhance sensitivity and decrease noise in the visible range.

Thermal Stability
All AvaSpec spectrometers have no moving parts inside and are extremely robust and stable.
The thermal stability of our spectrometers is part of our comprehensive quality control (QC) procedure and therefore closely monitored during the production and assembly process. All of our spectrometers undergo overnight thermal cycling, during which wavelength shift, intensity drop, and spectral tilt are registered and checked against our QC acceptance norm.
More specifically, the following tests are carried out during the thermal cycling process from 15°C to 25°C to 35°C and then back to 25°C:
Full Width at Half Maximum (FWHM)
During the thermal cycling process, the average FWHM value is measured and has to fit with a certain standard deviation within the QC acceptance norm for the different configurations, which can be found in our catalog.
Peak shift
During thermal cycling, the shift of peaks is monitored and depicted as shift in pixels per °C. Depending on the grating angle, the maximum allowed peak shift is defined, for most gratings the below values are the QC acceptance norm. For gratings with many lines/mm starting at high wavelengths (VD, VE), the peak shift can double.
Intensity stability and Spectral tilt
Temperature sensitivity on the intensity axis can have a number of reasons. First, the CCD detector itself has a temperature dependency, for most detectors, there are black pixels that are read out and are subtracted from the rest of the data pixels, the so-called ‘Correct for Dynamic Dark’ (CDD). However, CDD will not correct spectral tilt, which is partially a detector property as well. The aluminum optical bench and the optical components are engineered in such a way that the thermal expansion does not lead to a large increase in tilt or sensitivity.
For most spectrometers, the average intensity increase/decrease is within ±4% for ±10°C thermal cycling.
The figure below show a typical test result for a thermal cycling.

Spectrometer Platforms
AvaSpec StarLine
The AvaSpec StarLine family of instruments is compromised of high-performance spectrometers which exceed the demands of most general spectroscopy applications. The StarLine includes high-speed instruments for process control (AvaSpecULS2048CL-EVO and AvaSpec-FAST series), high-resolution instruments for demanding measurements like atomic emission (AvaSpec-ULS4096CL-EVO), and versatile instruments for common applications such as irradiance and absorbance chemistry (AvaSpec-ULS2048 & Avaspec-ULS2048CL). This instrument line offers an array of solutions for varied uses, while providing excellent price-to-performance ratios.
The AvaSpec-ULS2048CL-EVO and AvaSpec-ULS4096CL-EVO are based on CMOS arrays and can measure wavelengths from 200 to 1100 nm. The AvaSpec-FAST series of instruments is specially designed for high-speed acquisitions such as pulsed-light-source and laser measurements.
Instruments in the AvaSpec StarLine family are designed to perform in a variety of applications such as:
- Reflection and transmission measurements for optics, coatings, and colour measurements
- Irradiance and emission measurements for environmental industries, light characterization, and optical emission spectroscopy
- High-speed measurements for process control, LIBS or laser/pulsed-source characterization
- Absorbance Chemistry
AvaSpec StarLine instruments are fully integrated with Avantes’ modular platform, allowing them to function on a stand-alone basis or as multi-channel instruments. These products are fully compatible with other AvaSpec instruments in our AvaSpec SensLine and NIRLine. The entire AvaSpec StarLine is available as an individual lab instrument, as well as an OEM module for integration into customers’ existing systems.
The StarLine instruments are available with our standard ultra-low stray light (ULS) optical bench (75mm focal length) and with a number of premium options, such as irradiance/intensity and non-linearity calibration.

AvaSpec StarLine
In cases where size matters, the AvaSpec CompactLine family offers spectrometers with one of the smallest form factors on the market today. This compact size enables easier integration of our spectrometers into OEM and handheld devices. The AvaSpec StarLine is based on the AvaSpec-ULS2048CL and AvaSpec-ULS4096CL of the StarLine family. Squeezing down the size hardly compromises the performance of these instruments, but limits the customer a bit in configurations available. Customization is possible for an adequate number of instruments needed. Therefore, the CompactLine is especially well suited for OEM customers looking to integrate a spectrometer into their own instrument.

AvaSpec-MiniSensLine
The AvaSpec SensLine family of products is Avantes’ response to customers who require higher performance for demanding spectroscopy applications such as fluorescence, luminescence, and Raman. The AvaSpec SensLine product line includes high-sensitivity, low-noise spectrometers. Some of the instruments are based on back-thinned detector technology, of which some feature high-performance, thermoelectrically cooled detectors. The other models are based on standard CCDs, upgraded to high-performing instruments as a result of Avantes’ unique detector cooling technology. The back-thinned CCD detectors featured in the AvaSpec Sensline product family are high quantum efficiency detectors with excellent response in the UV, VIS, and NIR range from 200 to 1160 nm.
AvaSpec SensLine instruments are fully integrated with Avantes’ modular platform, allowing them to function on a standalone basis or as multi-channel instruments. These products are fully compatible with other AvaSpec instruments in our AvaSpec StarLine and AvaSpec NIRLine product families. The entire AvaSpec SensLine is available as a lab instrument or an OEM module for integration into a customers’ existing system.
Avantes’ innovative ultra-low stray light (ULS), revolutionary high-sensitivity (HS), and the optimum compromise (HSC) optical benches are the core optical technologies in the AvaSpec SensLine. These highly stable optical benches combined with our high-performance circuit boards make for high-performance instruments at affordable prices.
All members of the AvaSpec SensLine are designed to provide performance features such as:
- High stability
- High sensitivity
- High-speed acquisition
- Low noise

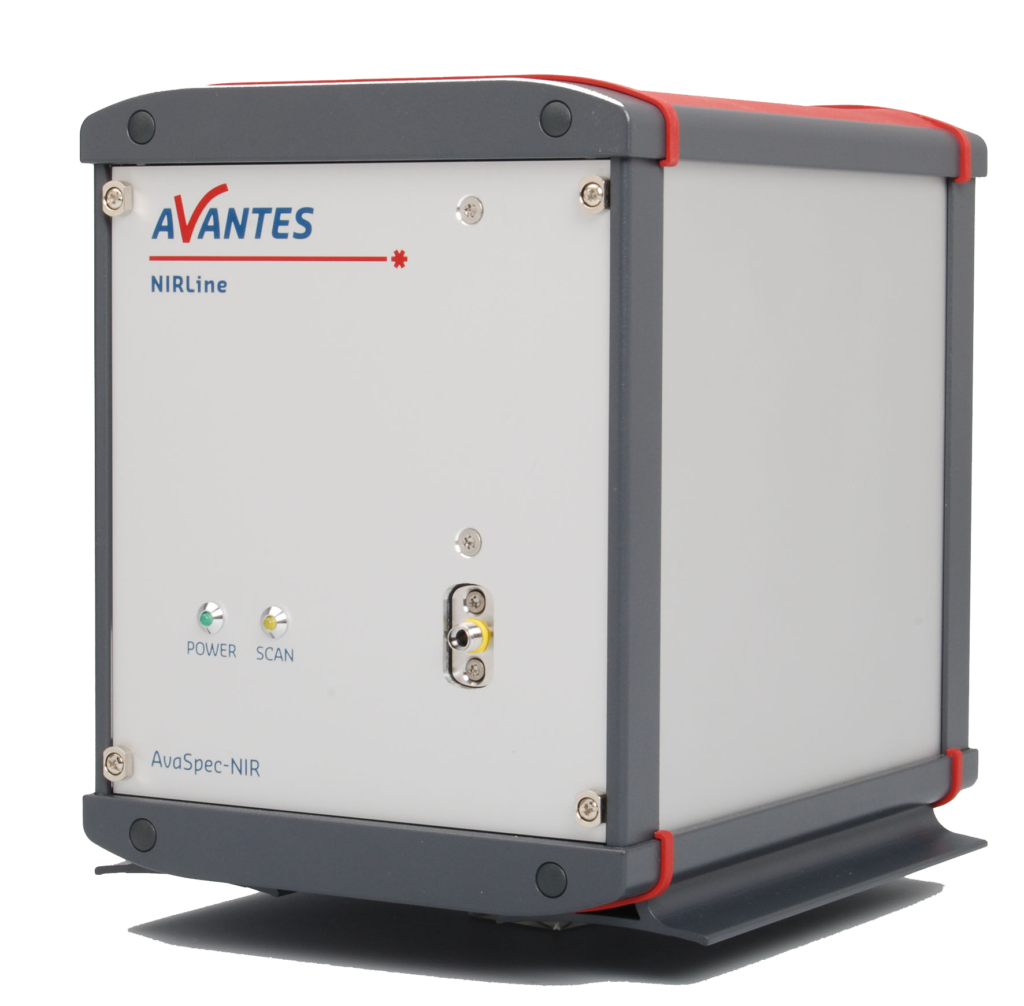
NIRLine
The AvaSpec NIRLine instruments are high-performance, near-infrared spectrometers that are optimized for the demands of measuring long wavelengths. This line provides leading-edge performance for dispersive NIR instruments with toroidal focusing mirrors and dynamic dark correction (DDC) for enhanced stability. The NIRLine is comprised of both thermoelectrically cooled and uncooled instruments. The AvaSpec-NIR256/512-1.7 features an uncooled 256 or 512-pixel InGaAs detector. All other instruments in the NIRLine have thermoelectric, Peltier-cooled InGaAs detectors which support cooling down to-25°C against ambient.
AvaSpec NIRLine instruments are fully compatible with our AvaSpec StarLine and SensLine spectrometers. Avantes’ AvaSpec NIRLine instruments are available as laboratory instruments or OEM modules and a number of premium options such as irradiance/intensity and non-linearity calibration are available as well.
The AvaSpec NIRLine of instruments are designed to perform in a variety of applications such as:
- Moisture content measurement of liquids, solids and powders for inline and quality control purposes
- Quantitative and qualitative measurement of volatile organics such as ethanol, and methanol
- Plastic characterization and material identification
- Irradiance measurements, such as solar monitoring
- Qualitative measurements of feed and food
Why choose Avantes for your application?
- Market leader in developing high-end fibre-optic spectroscopy systems
- Nearly 30 years of experience and extensive industry and application knowledge
- The best engineers who perform feasibility studies to find the right solution for your application
- A support team that never sleeps and provides second-to-none customer service